

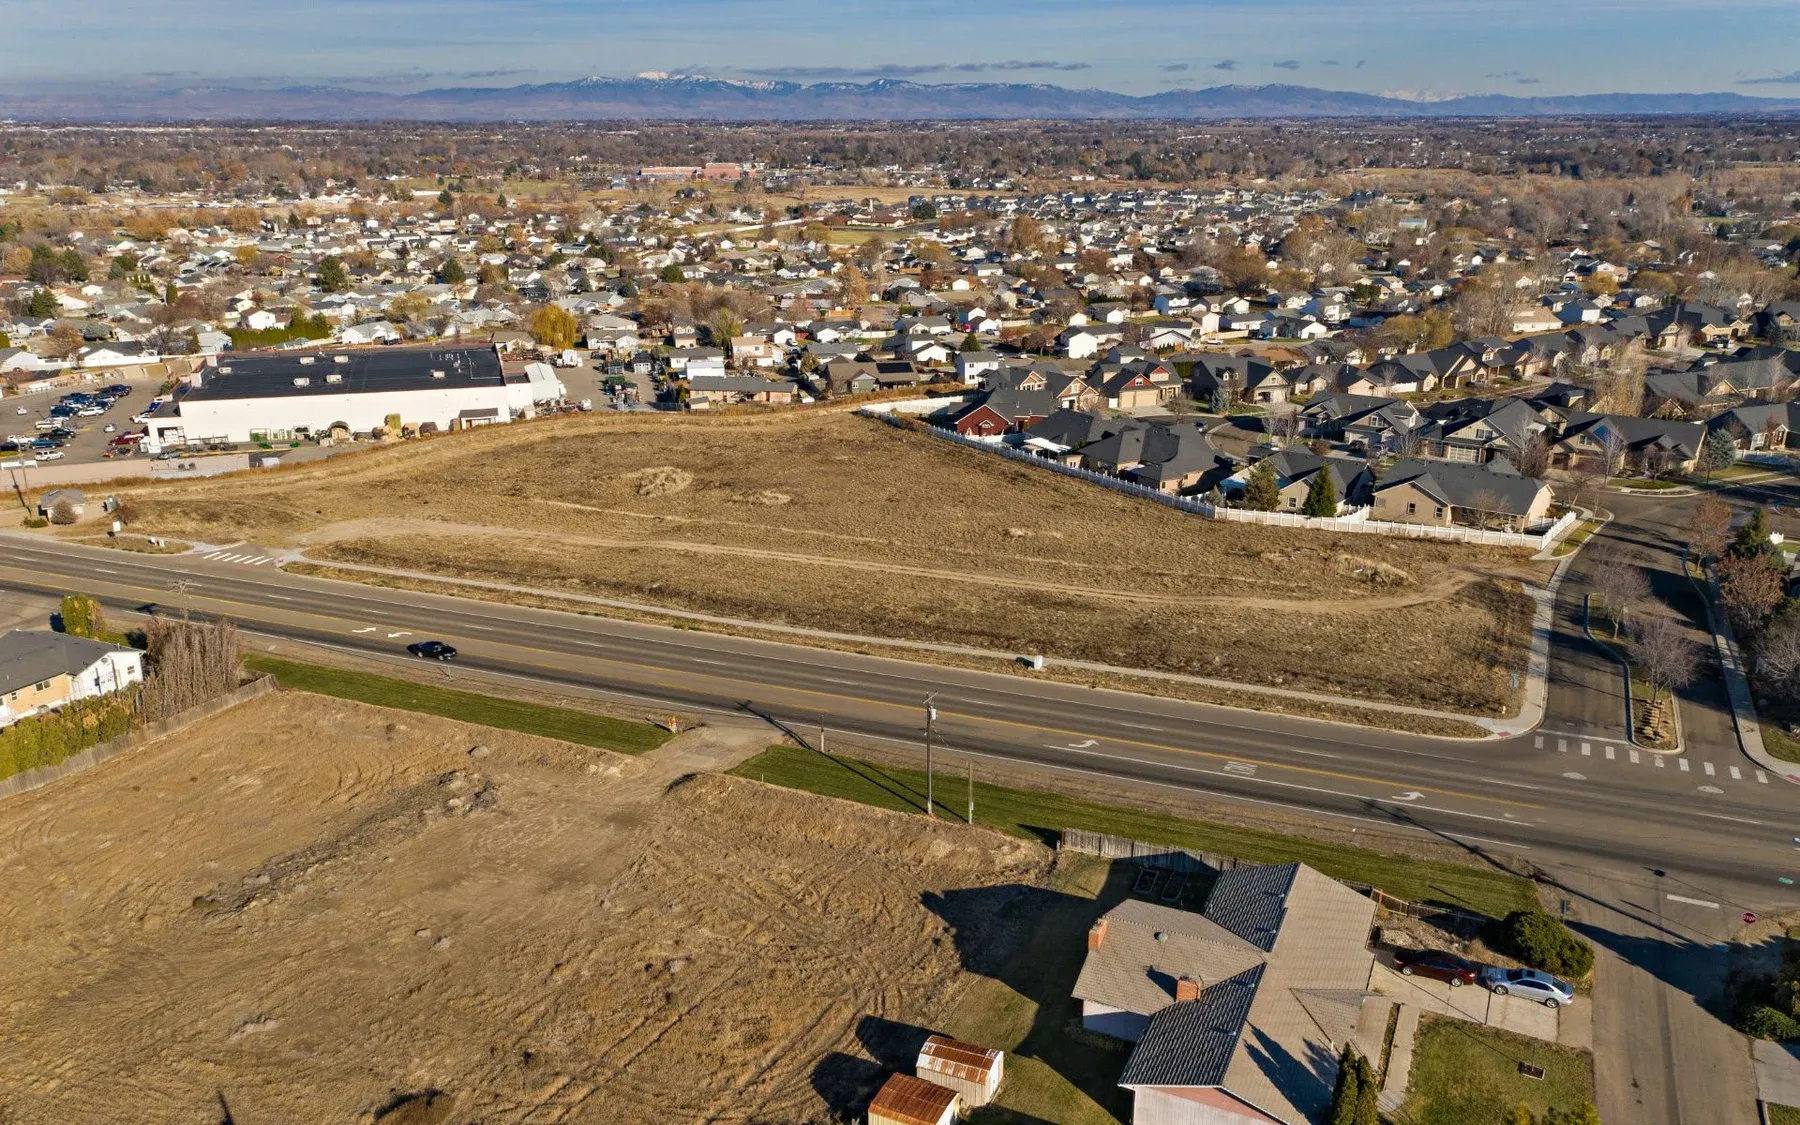
Nampa
Housing market report · data through August 2026
$415K typical home value +1.5% over the year
Typical home value, Nampa
$415K
+1.5% vs. Aug 2025
Typical rent, Nampa
$1,624/mo
+5.2% vs. Aug 2025
Median sold price, Canyon County
$443K
+3.2% vs. Aug 2025
Homes sold, Canyon County
472
+7.3% vs. Aug 2025
Source: Intermountain MLS public statistics, Canyon County, single-family homes, through August 2026. IMLS statistics are deemed reliable but not guaranteed and do not represent every property sold. Days on market is the time from listing to pending. Provided by IMLS for general market analysis. Copyright 2026 Intermountain Multiple Listing Service, Inc. IMLS statistics
Typical home value in Nampa, 2016 to today
Compared with the Boise metro
- Nampa
- Boise metro
Source: Zillow Home Value Index, through August 2026.
Data table
| Month | Nampa | Boise metro |
|---|---|---|
| Aug 2026 | $415K | $494K |
| Jul 2026 | $414K | $491K |
| Jun 2026 | $414K | $490K |
| May 2026 | $414K | $491K |
| Apr 2026 | $416K | $493K |
| Mar 2026 | $417K | $495K |
| Feb 2026 | $417K | $496K |
| Jan 2026 | $416K | $495K |
| Dec 2025 | $414K | $494K |
| Nov 2025 | $412K | $492K |
| Oct 2025 | $410K | $490K |
| Sep 2025 | $409K | $488K |
| Aug 2025 | $409K | $487K |
| Jul 2025 | $410K | $487K |
| Jun 2025 | $411K | $488K |
| May 2025 | $413K | $489K |
| Apr 2025 | $415K | $491K |
| Mar 2025 | $416K | $492K |
| Feb 2025 | $417K | $492K |
| Jan 2025 | $416K | $492K |
| Dec 2024 | $415K | $491K |
| Nov 2024 | $414K | $490K |
| Oct 2024 | $413K | $489K |
| Sep 2024 | $413K | $488K |
| Aug 2024 | $413K | $487K |
| Jul 2024 | $413K | $486K |
| Jun 2024 | $412K | $486K |
| May 2024 | $412K | $485K |
| Apr 2024 | $411K | $483K |
| Mar 2024 | $409K | $481K |
| Feb 2024 | $407K | $479K |
| Jan 2024 | $407K | $478K |
| Dec 2023 | $408K | $478K |
| Nov 2023 | $407K | $478K |
| Oct 2023 | $406K | $476K |
| Sep 2023 | $403K | $474K |
| Aug 2023 | $402K | $472K |
| Jul 2023 | $400K | $469K |
| Jun 2023 | $399K | $467K |
| May 2023 | $400K | $467K |
| Apr 2023 | $402K | $468K |
| Mar 2023 | $405K | $470K |
| Feb 2023 | $409K | $475K |
| Jan 2023 | $415K | $482K |
| Dec 2022 | $422K | $490K |
| Nov 2022 | $430K | $499K |
| Oct 2022 | $439K | $508K |
| Sep 2022 | $447K | $518K |
| Aug 2022 | $455K | $528K |
| Jul 2022 | $459K | $535K |
| Jun 2022 | $460K | $537K |
| May 2022 | $457K | $534K |
| Apr 2022 | $452K | $528K |
| Mar 2022 | $446K | $520K |
| Feb 2022 | $440K | $512K |
| Jan 2022 | $435K | $507K |
| Dec 2021 | $432K | $503K |
| Nov 2021 | $430K | $501K |
| Oct 2021 | $428K | $499K |
| Sep 2021 | $425K | $498K |
| Aug 2021 | $420K | $495K |
| Jul 2021 | $412K | $489K |
| Jun 2021 | $401K | $478K |
| May 2021 | $387K | $463K |
| Apr 2021 | $372K | $445K |
| Mar 2021 | $356K | $426K |
| Feb 2021 | $341K | $409K |
| Jan 2021 | $329K | $394K |
| Dec 2020 | $318K | $380K |
| Nov 2020 | $308K | $367K |
| Oct 2020 | $300K | $357K |
| Sep 2020 | $293K | $349K |
| Aug 2020 | $288K | $343K |
| Jul 2020 | $285K | $340K |
| Jun 2020 | $283K | $338K |
| May 2020 | $280K | $337K |
| Apr 2020 | $277K | $333K |
| Mar 2020 | $273K | $329K |
| Feb 2020 | $270K | $325K |
| Jan 2020 | $266K | $321K |
| Dec 2019 | $263K | $317K |
| Nov 2019 | $260K | $313K |
| Oct 2019 | $258K | $310K |
| Sep 2019 | $256K | $307K |
| Aug 2019 | $254K | $305K |
| Jul 2019 | $252K | $303K |
| Jun 2019 | $250K | $301K |
| May 2019 | $248K | $299K |
| Apr 2019 | $245K | $297K |
| Mar 2019 | $242K | $294K |
| Feb 2019 | $240K | $291K |
| Jan 2019 | $237K | $289K |
| Dec 2018 | $234K | $286K |
| Nov 2018 | $231K | $283K |
| Oct 2018 | $227K | $280K |
| Sep 2018 | $224K | $276K |
| Aug 2018 | $221K | $273K |
| Jul 2018 | $218K | $269K |
| Jun 2018 | $215K | $265K |
| May 2018 | $213K | $262K |
| Apr 2018 | $210K | $259K |
| Mar 2018 | $207K | $255K |
| Feb 2018 | $205K | $252K |
| Jan 2018 | $202K | $249K |
| Dec 2017 | $200K | $247K |
| Nov 2017 | $198K | $245K |
| Oct 2017 | $196K | $242K |
| Sep 2017 | $194K | $240K |
| Aug 2017 | $192K | $239K |
| Jul 2017 | $191K | $238K |
| Jun 2017 | $189K | $236K |
| May 2017 | $187K | $234K |
| Apr 2017 | $186K | $233K |
| Mar 2017 | $184K | $230K |
| Feb 2017 | $182K | $228K |
| Jan 2017 | $180K | $226K |
| Dec 2016 | $178K | $224K |
| Nov 2016 | $177K | $223K |
| Oct 2016 | $175K | $221K |
| Sep 2016 | $174K | $219K |
| Aug 2016 | $172K | $218K |
| Jul 2016 | $171K | $216K |
| Jun 2016 | $170K | $215K |
| May 2016 | $168K | $213K |
| Apr 2016 | $166K | $211K |
| Mar 2016 | $164K | $209K |
| Feb 2016 | $163K | $207K |
| Jan 2016 | $161K | $205K |
Full market report
Canyon County · August 2026
Existing homes vs new construction, listings, year-to-date and 12-month trends, from Intermountain MLS.
Listing Activity in Canyon County
The last three years, by month.
Active listings
Source: Realtor.com Residential Listings Database, Canyon County, through August 2026.
Data table
| Month | Active listings |
|---|---|
| Aug 2026 | 832 |
| Jul 2026 | 847 |
| Jun 2026 | 801 |
| May 2026 | 743 |
| Apr 2026 | 678 |
| Mar 2026 | 652 |
| Feb 2026 | 629 |
| Jan 2026 | 580 |
| Dec 2025 | 676 |
| Nov 2025 | 785 |
| Oct 2025 | 819 |
| Sep 2025 | 862 |
| Aug 2025 | 894 |
| Jul 2025 | 891 |
| Jun 2025 | 880 |
| May 2025 | 797 |
| Apr 2025 | 765 |
| Mar 2025 | 714 |
| Feb 2025 | 646 |
| Jan 2025 | 648 |
| Dec 2024 | 675 |
| Nov 2024 | 779 |
| Oct 2024 | 836 |
| Sep 2024 | 848 |
| Aug 2024 | 851 |
| Jul 2024 | 883 |
| Jun 2024 | 844 |
| May 2024 | 739 |
| Apr 2024 | 640 |
| Mar 2024 | 590 |
| Feb 2024 | 548 |
| Jan 2024 | 517 |
| Dec 2023 | 562 |
| Nov 2023 | 639 |
| Oct 2023 | 755 |
| Sep 2023 | 743 |
| Aug 2023 | 704 |
Median days on market
Source: Realtor.com Residential Listings Database, Canyon County, through August 2026.
Data table
| Month | Days on market |
|---|---|
| Aug 2026 | 46 |
| Jul 2026 | 42 |
| Jun 2026 | 38 |
| May 2026 | 37 |
| Apr 2026 | 39 |
| Mar 2026 | 36 |
| Feb 2026 | 37 |
| Jan 2026 | 65 |
| Dec 2025 | 67 |
| Nov 2025 | 59 |
| Oct 2025 | 54 |
| Sep 2025 | 49 |
| Aug 2025 | 49 |
| Jul 2025 | 46 |
| Jun 2025 | 44 |
| May 2025 | 43 |
| Apr 2025 | 38 |
| Mar 2025 | 40 |
| Feb 2025 | 45 |
| Jan 2025 | 64 |
| Dec 2024 | 62 |
| Nov 2024 | 59 |
| Oct 2024 | 53 |
| Sep 2024 | 53 |
| Aug 2024 | 52 |
| Jul 2024 | 45 |
| Jun 2024 | 43 |
| May 2024 | 34 |
| Apr 2024 | 38 |
| Mar 2024 | 39 |
| Feb 2024 | 51 |
| Jan 2024 | 71 |
| Dec 2023 | 64 |
| Nov 2023 | 56 |
| Oct 2023 | 51 |
| Sep 2023 | 46 |
| Aug 2023 | 45 |
Share of listings with a price cut
Source: Realtor.com Residential Listings Database, Canyon County, through August 2026.
Data table
| Month | Price-reduced share |
|---|---|
| Aug 2026 | 17% |
| Jul 2026 | 18% |
| Jun 2026 | 16% |
| May 2026 | 12% |
| Apr 2026 | 14% |
| Mar 2026 | 13% |
| Feb 2026 | 12% |
| Jan 2026 | 15% |
| Dec 2025 | 14% |
| Nov 2025 | 19% |
| Oct 2025 | 22% |
| Sep 2025 | 22% |
| Aug 2025 | 20% |
| Jul 2025 | 22% |
| Jun 2025 | 23% |
| May 2025 | 19% |
| Apr 2025 | 16% |
| Mar 2025 | 13% |
| Feb 2025 | 11% |
| Jan 2025 | 14% |
| Dec 2024 | 14% |
| Nov 2024 | 14% |
| Oct 2024 | 20% |
| Sep 2024 | 19% |
| Aug 2024 | 22% |
| Jul 2024 | 21% |
| Jun 2024 | 22% |
| May 2024 | 20% |
| Apr 2024 | 14% |
| Mar 2024 | 13% |
| Feb 2024 | 12% |
| Jan 2024 | 13% |
| Dec 2023 | 14% |
| Nov 2023 | 18% |
| Oct 2023 | 23% |
| Sep 2023 | 20% |
| Aug 2023 | 17% |
Median list price
Source: Realtor.com Residential Listings Database, Canyon County, through August 2026.
Data table
| Month | Median list price |
|---|---|
| Aug 2026 | $500K |
| Jul 2026 | $505K |
| Jun 2026 | $502K |
| May 2026 | $500K |
| Apr 2026 | $514K |
| Mar 2026 | $515K |
| Feb 2026 | $512K |
| Jan 2026 | $500K |
| Dec 2025 | $496K |
| Nov 2025 | $500K |
| Oct 2025 | $500K |
| Sep 2025 | $500K |
| Aug 2025 | $490K |
| Jul 2025 | $500K |
| Jun 2025 | $500K |
| May 2025 | $500K |
| Apr 2025 | $485K |
| Mar 2025 | $482K |
| Feb 2025 | $478K |
| Jan 2025 | $489K |
| Dec 2024 | $488K |
| Nov 2024 | $490K |
| Oct 2024 | $494K |
| Sep 2024 | $500K |
| Aug 2024 | $491K |
| Jul 2024 | $468K |
| Jun 2024 | $479K |
| May 2024 | $482K |
| Apr 2024 | $470K |
| Mar 2024 | $477K |
| Feb 2024 | $482K |
| Jan 2024 | $475K |
| Dec 2023 | $480K |
| Nov 2023 | $486K |
| Oct 2023 | $496K |
| Sep 2023 | $503K |
| Aug 2023 | $508K |
What’s Your Nampa Home Worth?
Enter when you bought and what you paid.
| Population | 110,319 |
|---|---|
| Households | 39,134 |
| Average household size | 2.76 |
| Median age | 33.9 |
| Average individual income | $32,417 |
Source: U.S. Census Bureau, American Community Survey 2020–2024 5-year estimates. Income is per person.
Explore Other Cities




Buying or Selling in Nampa?
We’ll pull recent Nampa sales and tell you plainly what they mean for your price.
Contact Us